
Quick Start
Choose Your Method
View Results
After analysis completes, explore your results in the interactive dashboard
About MMonitor
MMonitor is an open-source software platform for the real-time analysis and visualization of metagenomic Oxford Nanopore Technologies (ONT) sequencing data. It provides a desktop application for running bioinformatics pipelines and a web-based dashboard for interactive result inspection, including taxonomic composition over time, quality scores, diversity indices, and taxonomy-metadata correlations.
For comprehensive documentation, detailed methodology, and validation results, please refer to our official publication and GitHub repository.
Lucas, T. N., Biehain, U., Gautam, A., et al.
MMonitor for Real-Time Monitoring of Microbial Communities Using Long Reads.
Cell Reports Methods (Elsevier, 2025)
DOI:
https://doi.org/10.1016/j.crmeth.2025.101266
Please cite this paper if you use MMonitor in your research.
GitHub Repository
Access the source code, contribute, and find detailed documentation on our GitHub repository.
Visit GitHub RepositoryDashboard Applications
Explore your metagenomic data through our interactive dashboard applications, each designed for specific analysis tasks:
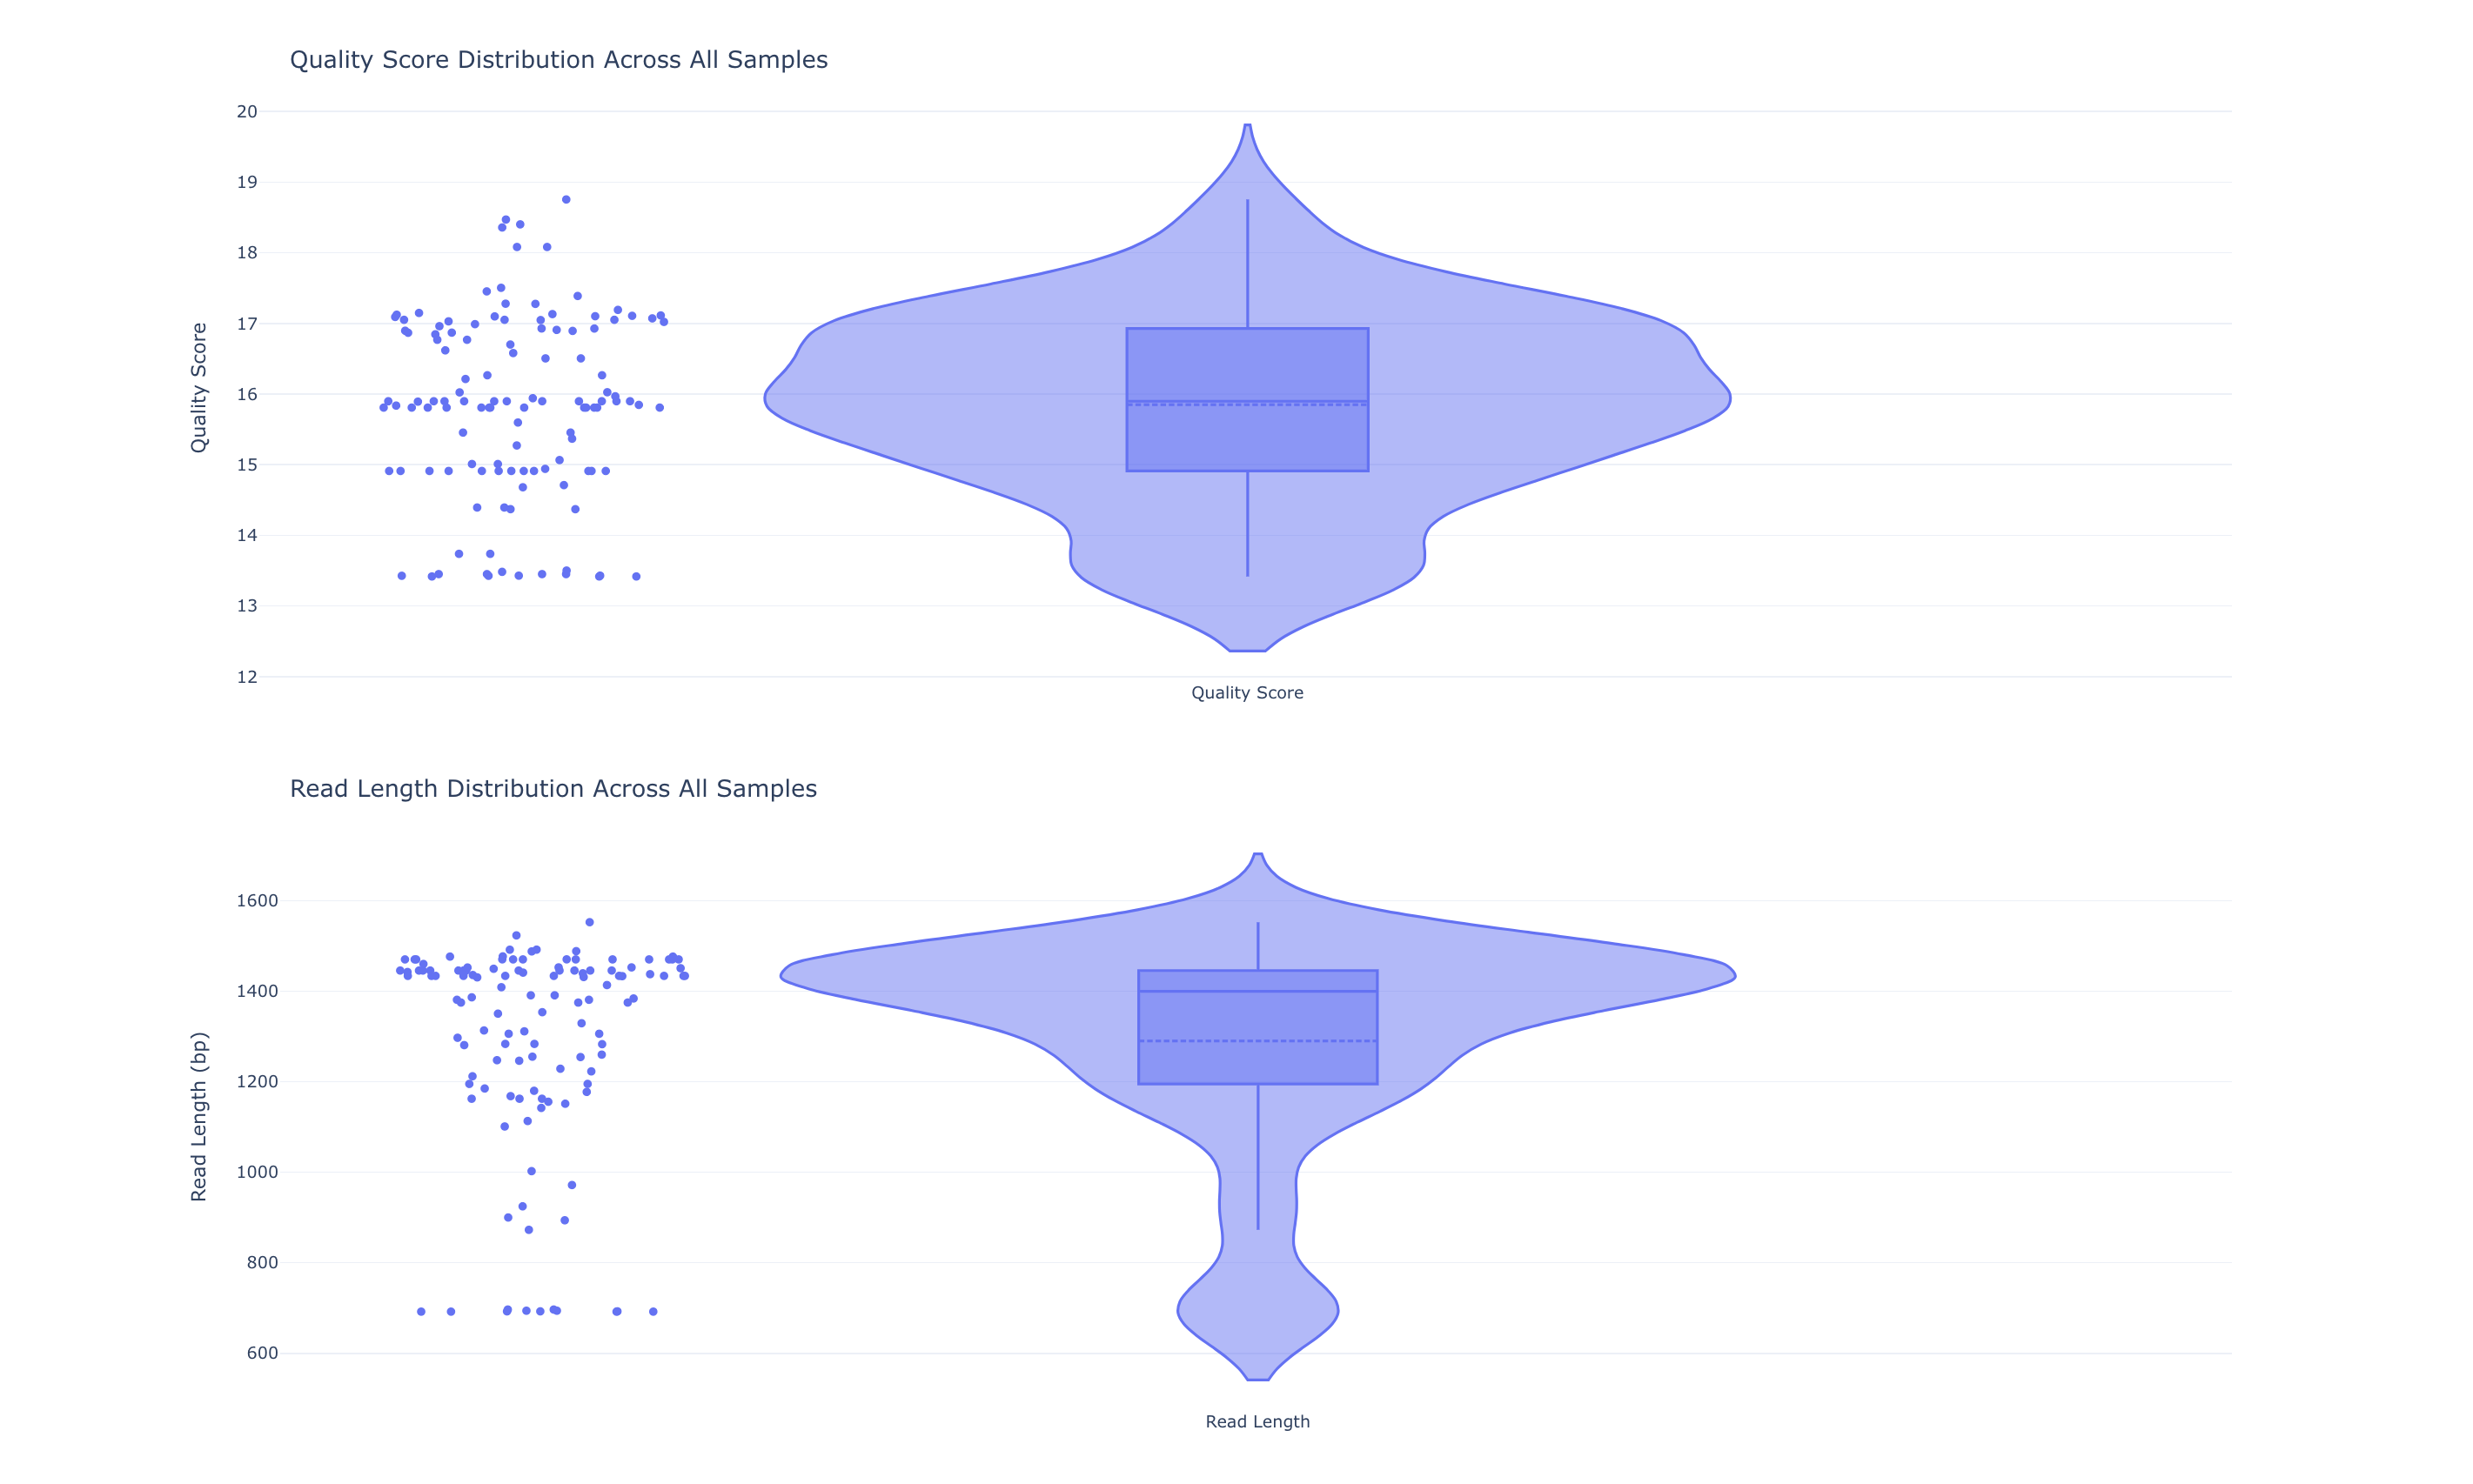
QC
Overview of common quality metrics of the input data
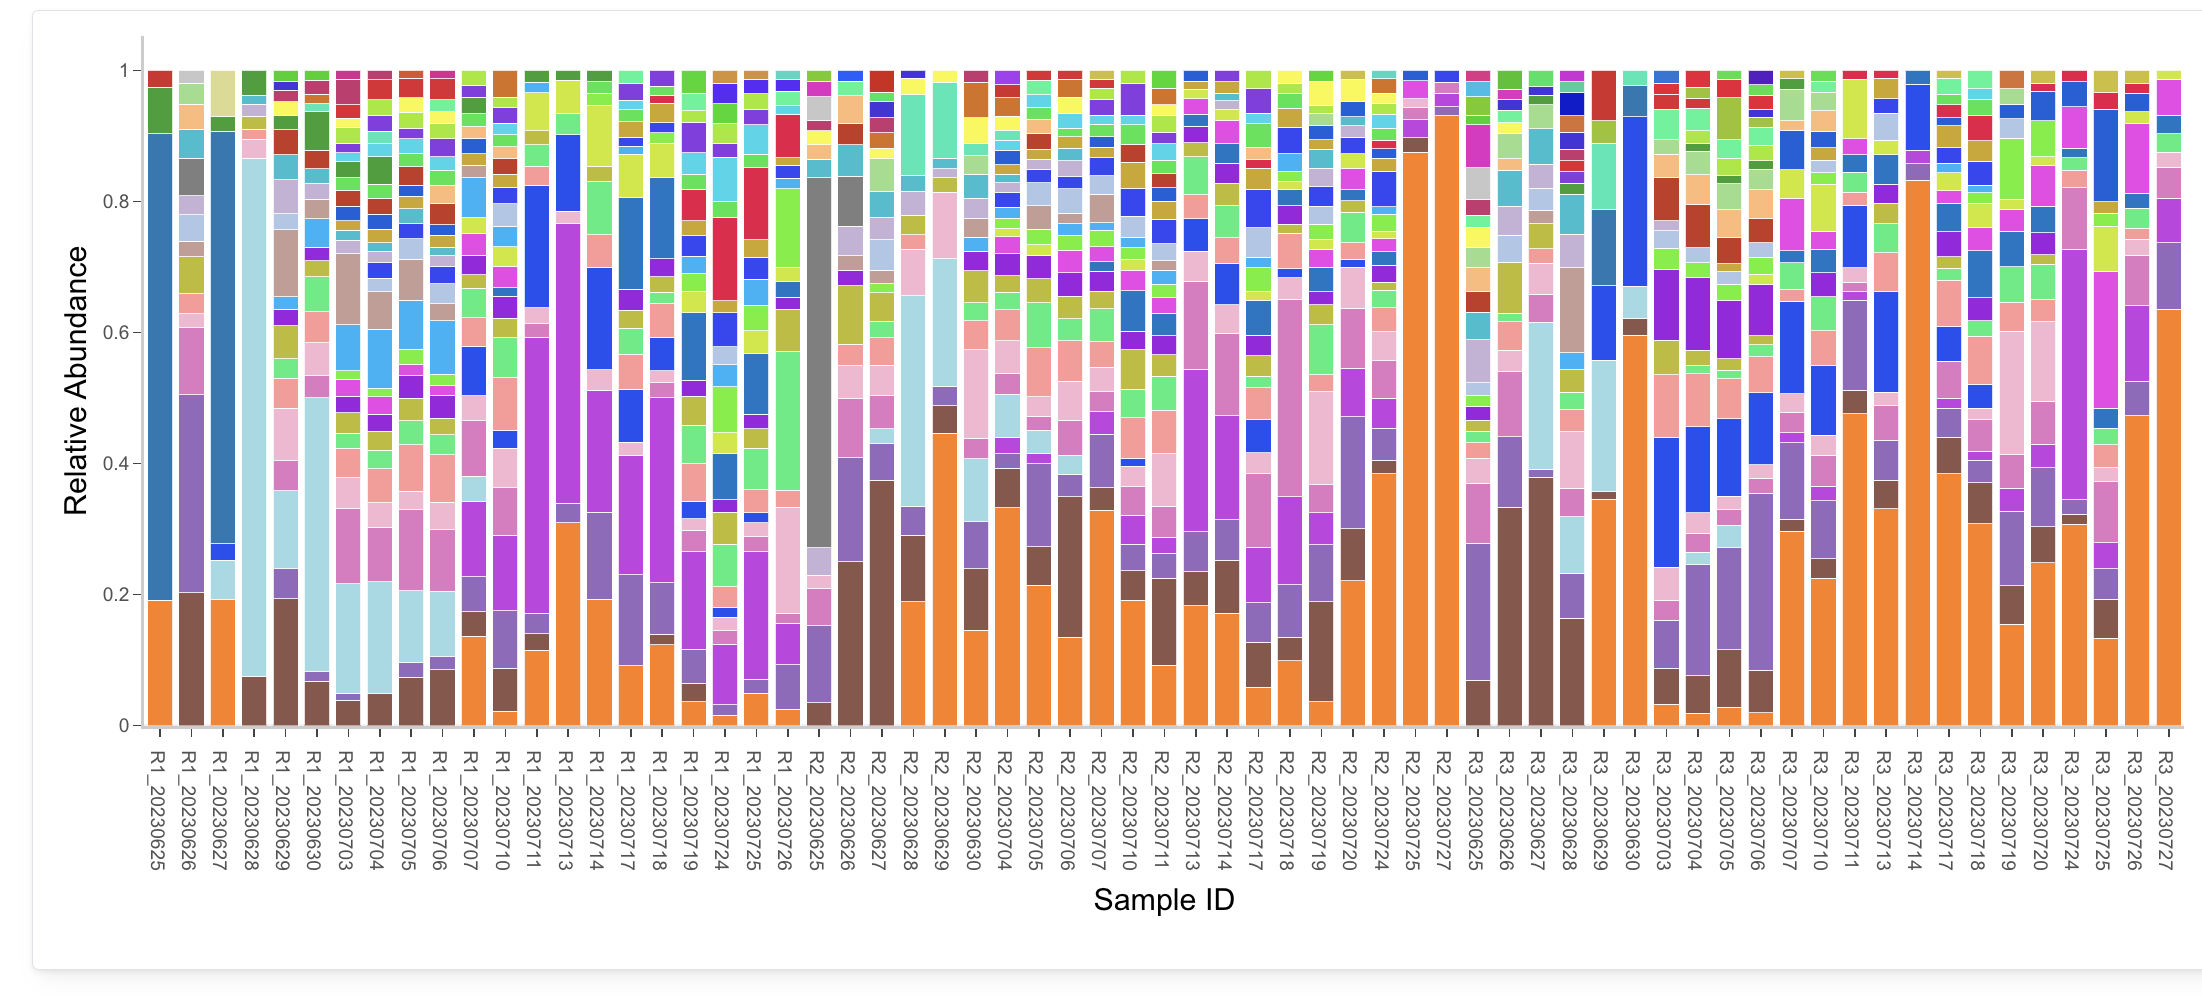
Taxonomy
Analyze the taxonomic composition of metagenome samples
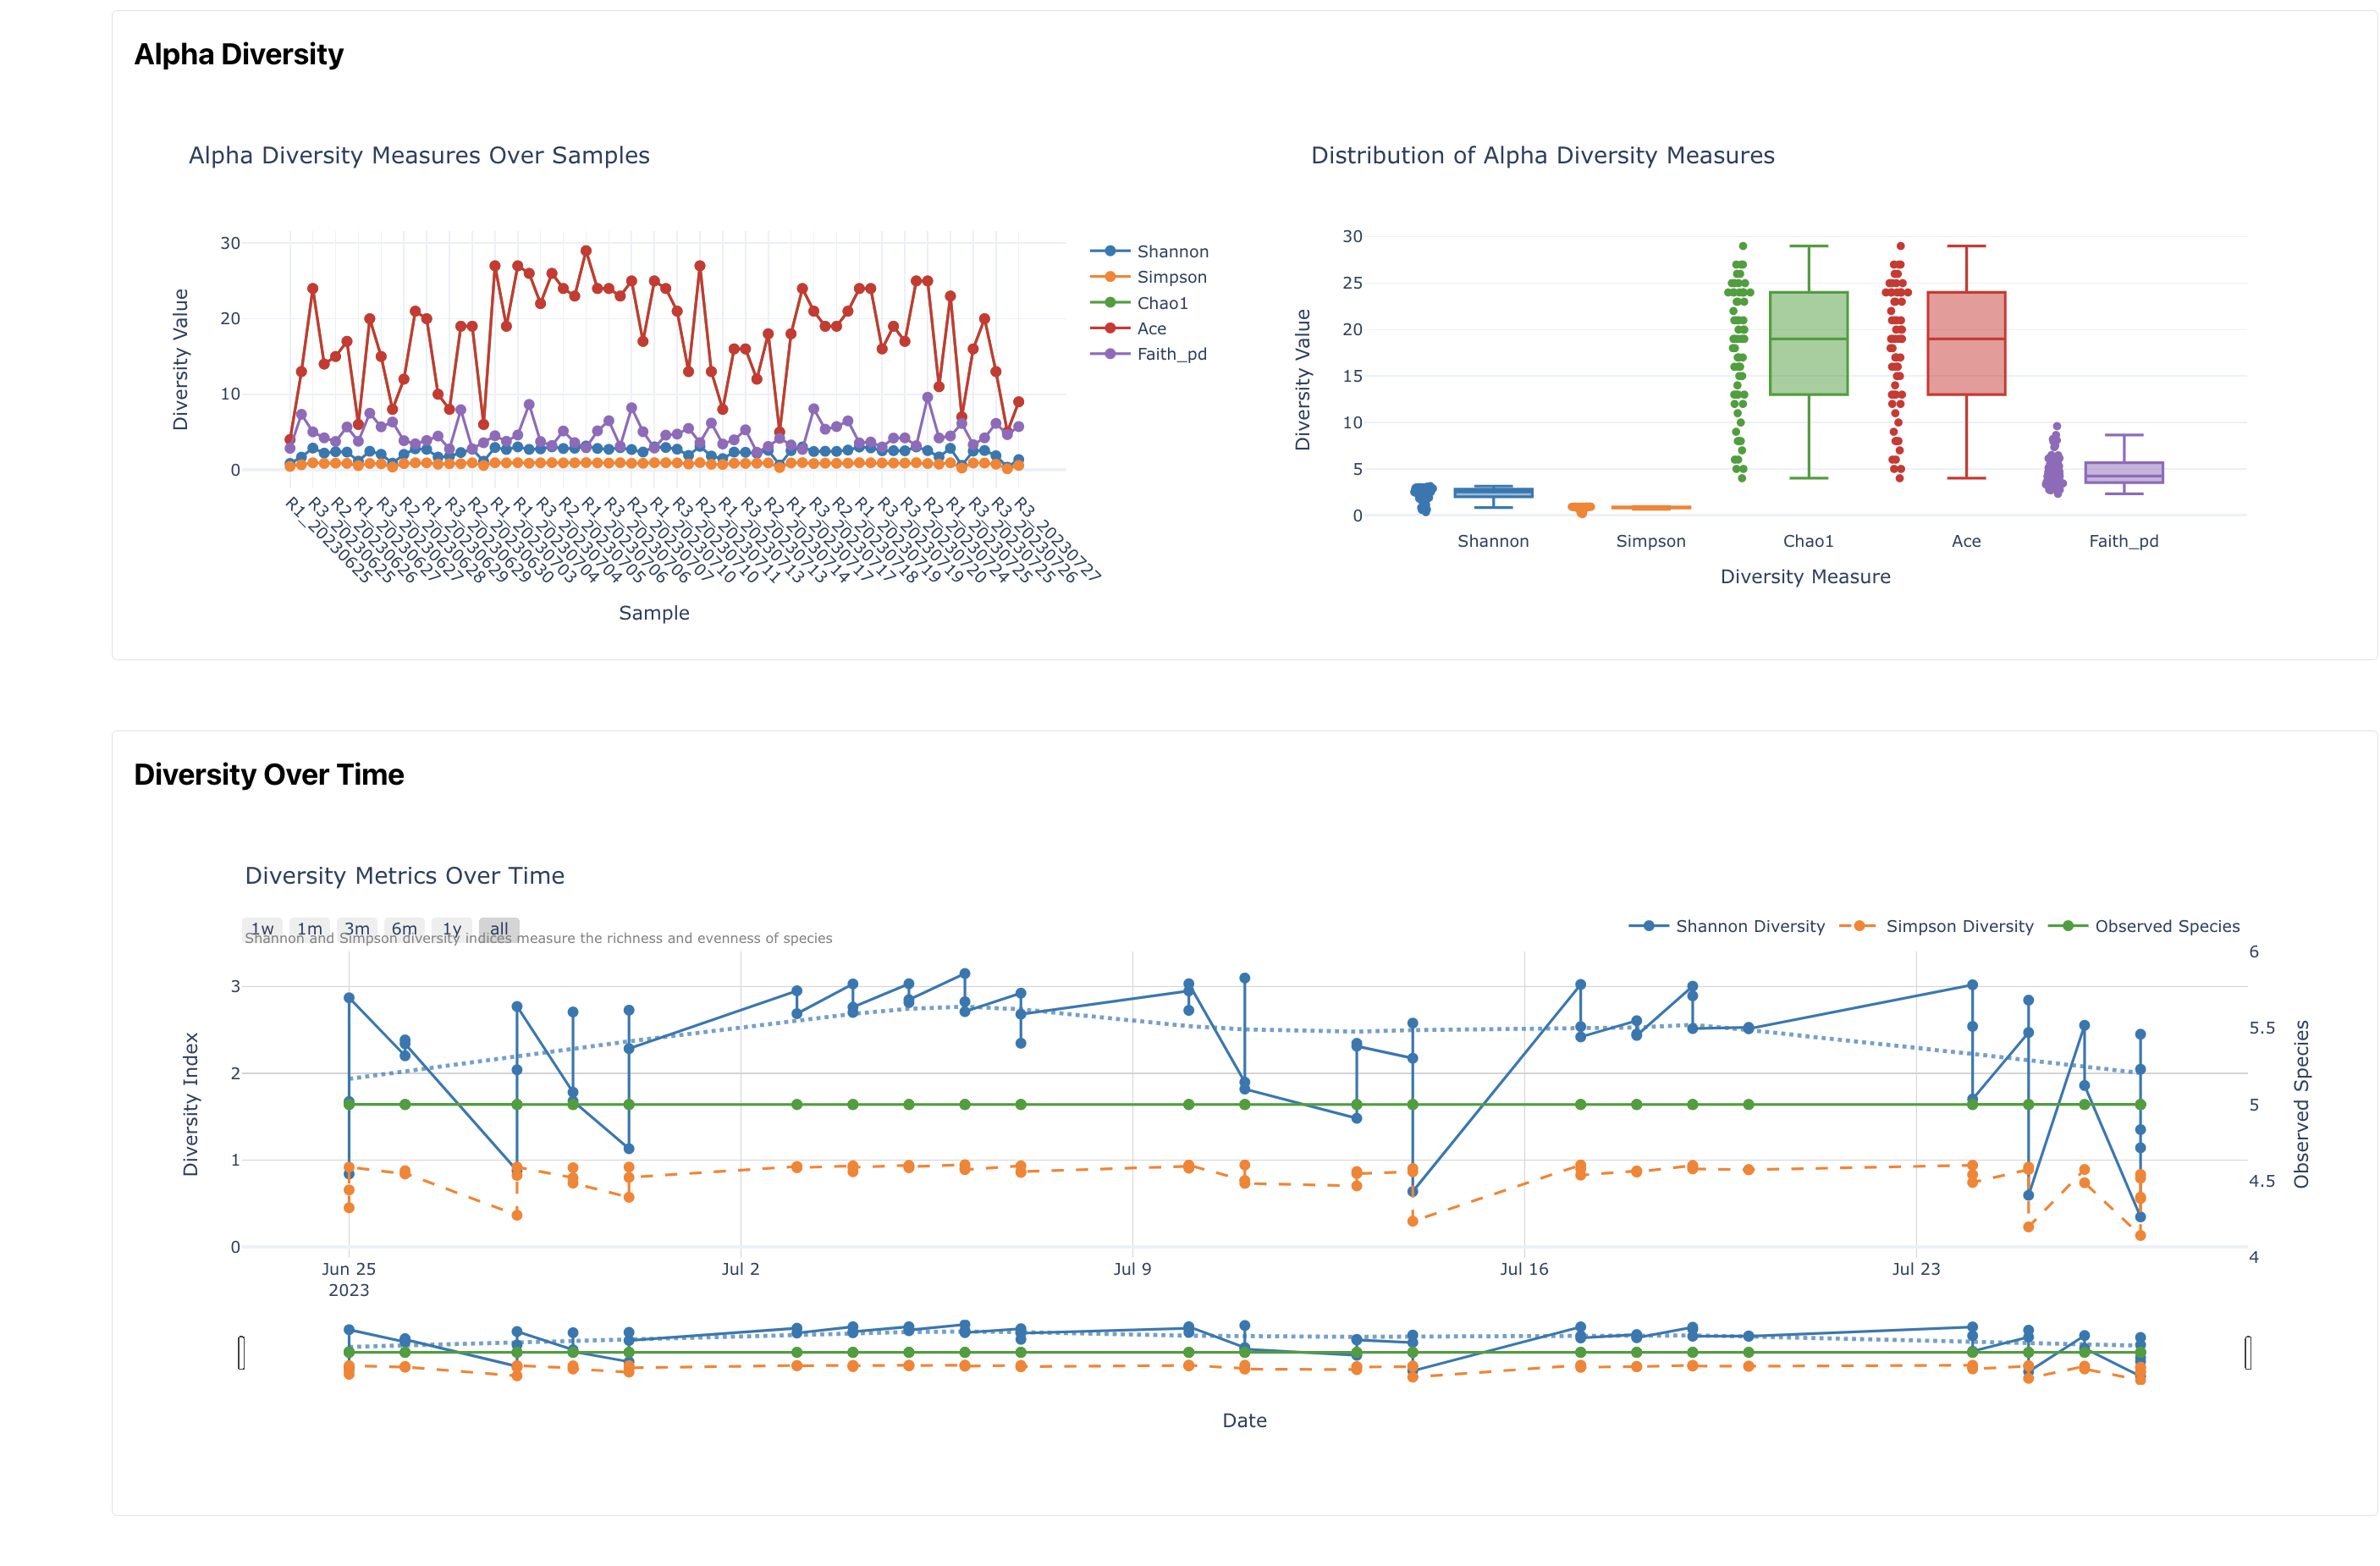
Diversity
Overview of diversity metrics, including alpha and beta diversity, PCoA plots and rarefaction curves
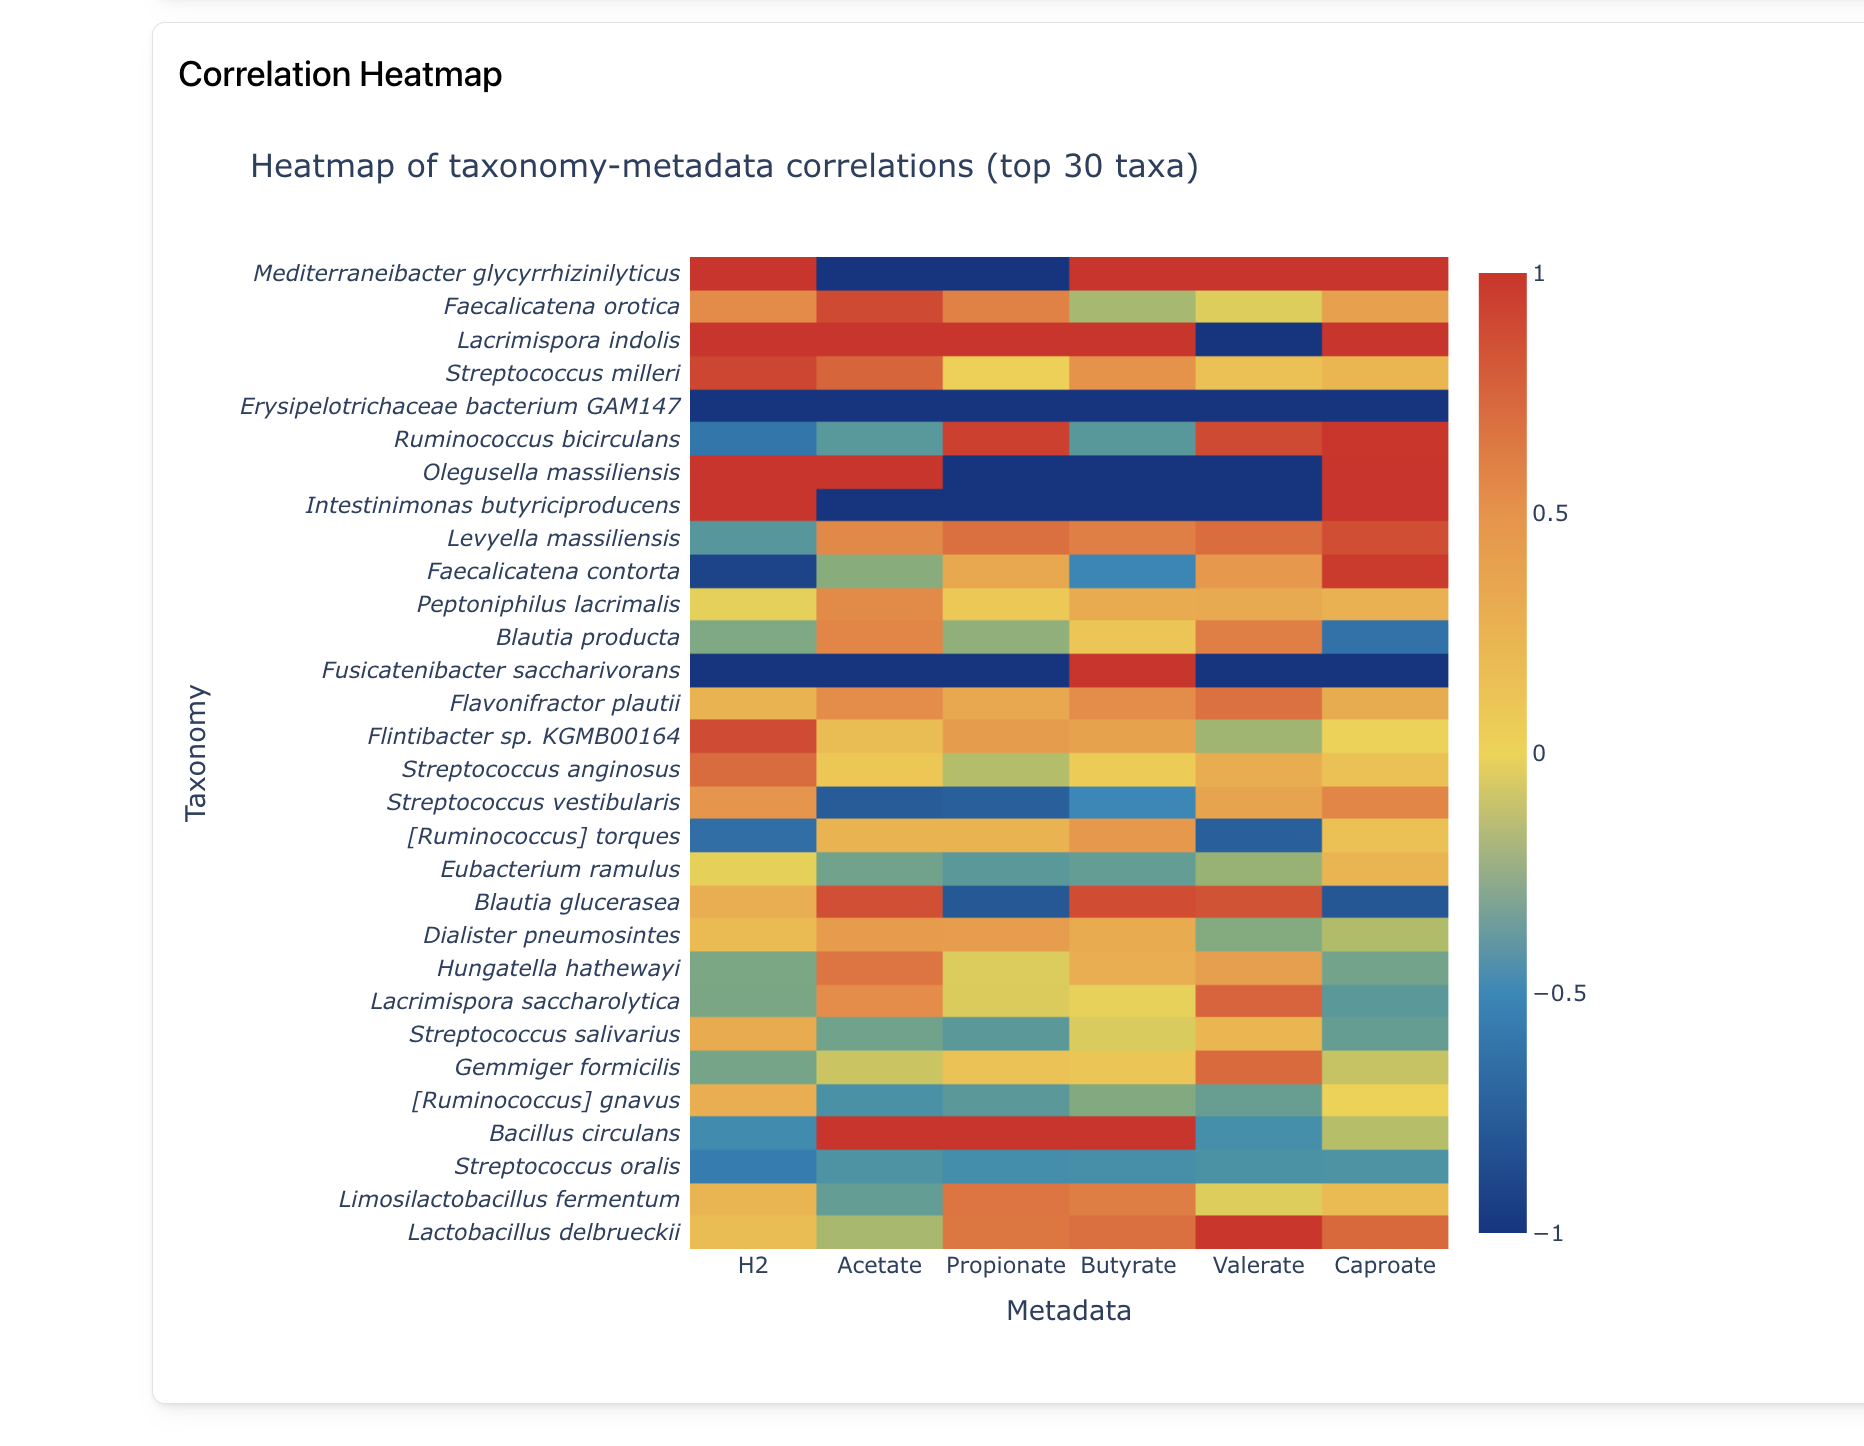
Correlations
Correlate metagenomic data with external metadata to highlight important variables
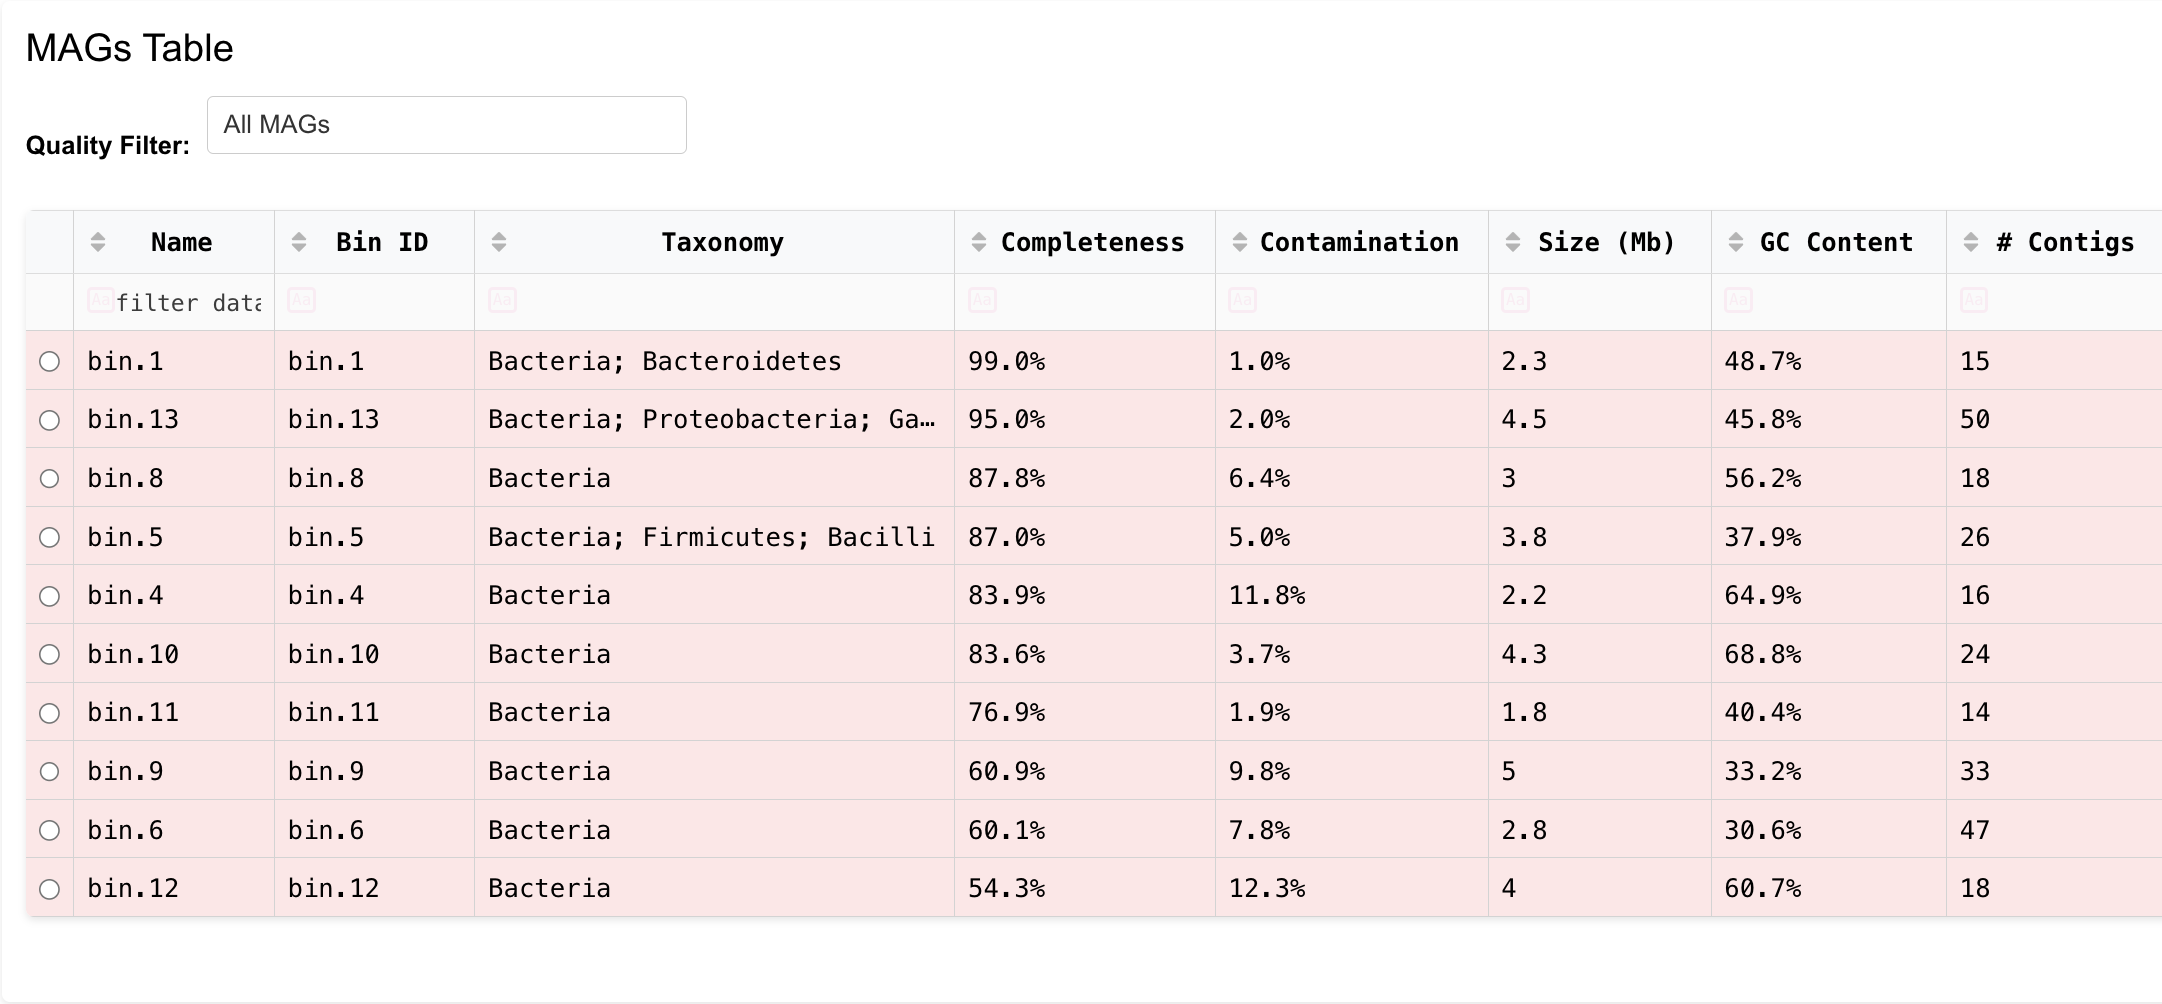
MAGs
Analyze MAGs with genome visualization and annotations
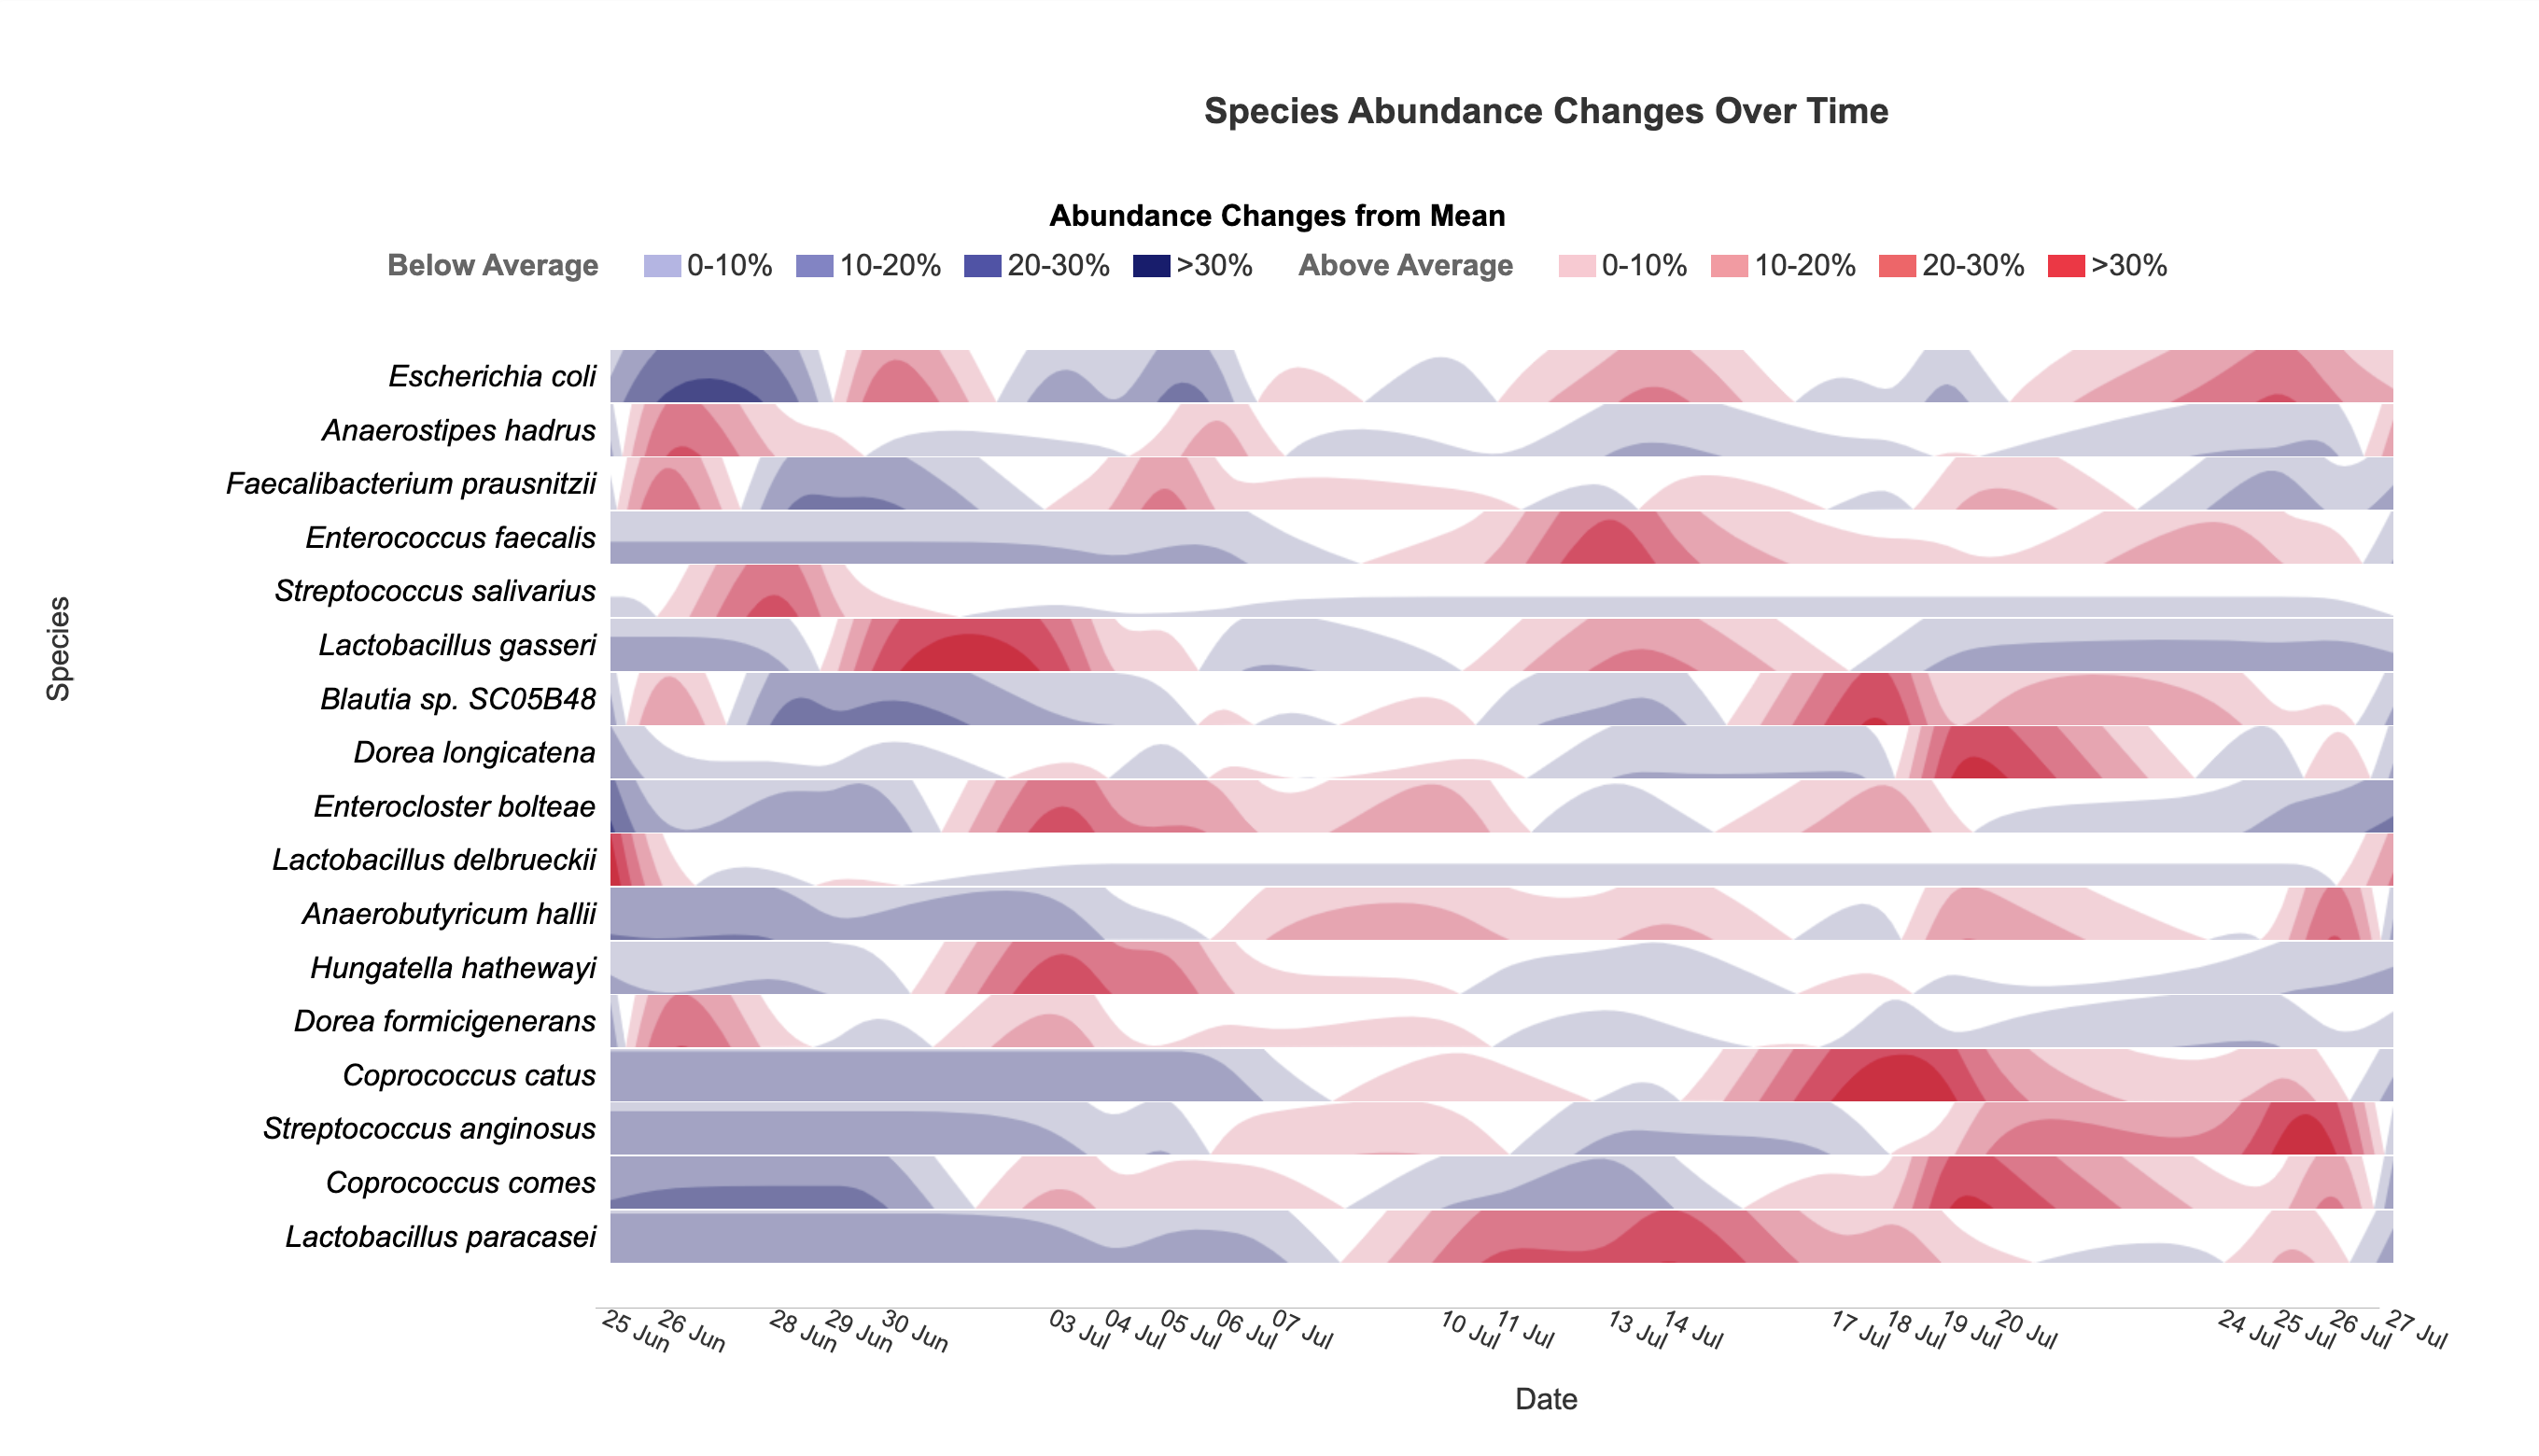
Horizon
Visualize taxonomic abundance changes over time with interactive horizon charts
Loading image...
Installation and Documentation
For installation instructions and detailed documentation, please visit our GitHub repository.